Hi, guys, welcome back to Appsloveworld. In our previous article, we learned about How to Create Multi-Line Chart Using Chart js in detail. And now moving ahead, let’s learn about another great feature of Chart Js i.eHow we can create straight lines and curves lines in the same graph using Chart.js.
Straight lines and curves lines in the same graph
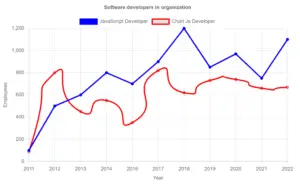
we can create this task using the lineTension option of dataset ,bezierCurve is a chart level option using that we can the curved of the line chart. In the below example, we have taken two datasets i. eJavaScript Developer and Chart Js Developer. and for Chart Js Developer we have set lineTension to 1.
<!DOCTYPE html>
<html>
<head>
    <title>Chart.js-Multi line charts </title>
    <script src="https://cdn.jsdelivr.net/npm/[email protected]/dist/chart.min.js"></script>
</head>
<body>
    <div style="margin-left:5%;margin-right:5%">
        <canvas id="myLineChart" style="width:100%;max-width:80%"></canvas>
    </div>
    <script>
var xValues = [2011, 2012, 2013, 2014, 2016, 2017, 2018, 2019, 2020, 2021, 2022];
const MultiLinechartData = {
            type: "line",
            data: {
                labels: xValues,
                datasets: [
                    {
                        label: 'JavaScript Developer',
                        lineTension: 0,
                        backgroundColor: 'blue',
                        borderColor: 'blue',
                        data: [100, 500, 600, 800, 700, 900, 1200, 850, 970, 750, 1100]
                    },
                    {
                        label: 'Chart Js Developer',
                        lineTension: 1,
                        borderColor: 'red',
                        data: [88, 800, 450, 550, 350, 820, 620, 730, 740, 660, 669]
                    }
                ]
            },
            options: {
                plugins: {
                    title: {
                        display: true,
                        text: 'Software developers in organization',
                    }
                },
                scales: {
                    x: {
                        display: true,
                        title: {
                            display: true,
                            text: 'Year'
                        }
                    },
                    y: {
                        display: true,
                        title: {
                            display: true,
                            text: 'Employees'
                        }
                    }
                }
            }
        };
new Chart("myLineChart", MultiLinechartData);
    </script>

</body>
</html>
*Thank you so much if you have a question please comment
Above JavaScript code is used to create a multiline chart using the Chart.js library.
var xValues = [2011, 2012, 2013, 2014, 2016, 2017, 2018, 2019, 2020, 2021, 2022]; - This array holds the x-axis values (years) for the data points in the chart.
const MultiLinechartData = { ... } - This variable defines the configuration object for the multiline chart.
data: { ... } - This object contains the data to be displayed on the chart.
labels: xValues - Specifies the labels (years) for the x-axis.
datasets: [ ... ] - An array containing multiple datasets, each representing a line on the chart.
Each dataset object contains:
label: The label for the dataset (e.g., 'JavaScript Developer', 'Chart Js Developer').
lineTension: Determines the tension of the line. A value of 0 makes the line straight, while higher values make it curved.
backgroundColor and borderColor: Define the color of the line.
data: An array of y-axis values corresponding to each x-axis value (year).
new Chart("myLineChart", MultiLinechartData); - Finally, this code creates a new Chart.js chart instance with the specified ID ("myLineChart") and the configuration defined in MultiLinechartData.
Above code generates a multiline chart showing the number of employees in an organization over the years, with each line representing a different type of developer (e.g., JavaScript Developer, Chart Js Developer).
So what I want to do here is it will be green. So I want to grab this green color here, I’ll set it in green, and else if that’s not the case I want the default color of red. We’re going to put it in their semicolon.
All right, so now we have this here and then of course what we need to do is to return so we’ll look through every item here based on this condition, and then it will return the matching value. So we say return it will say here return the value of the color.