In this article, we're going to answer the question of how to display only points without lines in Chart.js. we are going to remove the connecting lines between dots in the line chart, focusing solely on showing the dots themselves.
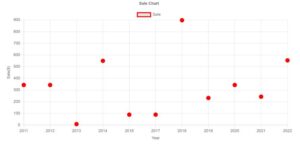
To hide the line chart and only show the dots, we just need to set the showLine property of chart js to false.As shown in below example.
 datasets: [
                    {
                        label: 'Sale',
                        lineTension: 0,
                        borderColor: 'red',
                        data: [343, 343, 8, 550, 89, 89, 898, 232, 343, 243, 554],
                        pointBackgroundColor: 'red',
                        pointRadius: 6,
                        showLine: false
                    }
                ]
Show just points without lines
<!DOCTYPE html>
<html>
<head>
    <title>ChartJS-How to leave just points without lines</title>
    <script src="https://cdn.jsdelivr.net/npm/[email protected]/dist/chart.min.js"></script>
</head>
<body>
    <div style="margin-left:5%;margin-right:5%">
        <canvas id="myLineChart" style="width:100%;max-width:100%"></canvas>
    </div>
    <script>
var xValues = [2011, 2012, 2013, 2014, 2016, 2017, 2018, 2019, 2020, 2021, 2022];
const MultiLinechartData = {
            type: "line",
            data: {
                labels: xValues,
                datasets: [
                    {
                        label: 'Sale',
                        lineTension: 0,
                        borderColor: 'red',
                        data: [343, 343, 8, 550, 89, 89, 898, 232, 343, 243, 554],
                        pointBackgroundColor: 'red',
                        pointRadius: 6,
                        showLine: false //this line very importnent for hiding lines
                    }
                ]
            },
            options: {
                plugins: {
                    title: {
                        display: true,
                        text: 'Sale Chart',
                    }
                },
                scales: {
                    x: {
                        display: true,
                        title: {
                            display: true,
                            text: 'Year'
                        }
                    },
                    y: {
                        display: true,
                        title: {
                            display: true,
                            text: 'Sale($)'
                        }
                    }
                }
            }
        };
new Chart("myLineChart", MultiLinechartData);
    </script>

</body>
</html>
*Thank you so much if you have a question please comment
And please note the ID My chart here. Keep this in mind before we now jump into our script JS which we create now basically let me move this a little bit away. Alright, welcome to the JavaScript part here. So first of all let’s create a new variable, let My chart one, and query our Mychartone ID. So document get element by ID like this and let’s query the My chart ID on the canvas element from our HTML.
So when we go back here My chart this ID here we are getting this and we have to set the context here. Forget context because we are creating two-dimensional charts here. Next, a new variable, let chart one which actually creates a renders chart. So for this, we can use a comment new chart. We have to give our variable here where the My chart ID is queried.
So My chart one and basically this is being used to render the chart now and basically first of all for all charts, it’s the same when we use the charts we have to specify a type and we want to start with a Don not chart here so let’s give it a type of donut and then already we can specify data and it’s really nice because it’s all following adjacent structure here which makes it.
Very easy to navigate through and define the necessary steps and variables. So coming to our data, we can define labels. And we will come to this in a minute. First of all, let me just let’s labels one here. Next, we can define the data sets because potentially we could have several sets on a chart.
So we will come to this labels one data, one colors, one in just a minute. Just ignore it for now. So after we are finished with the data sets, we can close the data tag here. So we’re closing this data stuff here, and then we move on with comma, and we can specify certain options and the options we can define stuff like, for example, a title. And for the title, we have, again, two options in this case.
Let me enter this a little bit. In this case, the question we want to answer with our donor chart. So in this case, as we are using a Donut chart, why not asking the question, do you like Donuts? And we can set the display of the title to true.
I think that’s it already for the Donut chart. So basically, we need to specify the type, the title. So basically the question we want to answer with this chart. And then now we have to come back to our labels, data and colors.
So basically, for the labels I just gave it or specified it as labels one. Let’s just create a variable labeled one here on the top, which we will hand in the values here. Yes. So do you like Donuts, yes or yes? And you will see what’s behind this in a minute.
so let’s get back to Adam. That is where we stopped. Let’s move to our index file.
Read Similar Articles
- How to Create Curved Lines Instead of Straight Lines in Chart.js?
- [Simple Trick]-How to Hide Some Points in ChartJS
- How to Create a Stacked Bar Chart Using Chart Js Example?
- [Chart Js]- Straight Lines and Curves Lines in the Same Graph
- [Simple Trick]-How to display Grouped Bar Chart Using Chart Js?
- [Simple Trick]-How to Combined Bar and line charts Using Chart.js?
- How to leave just points without lines in ChartJS
- [Simple Trick]-Set Different Color For Each Bar in a Bar Chart in ChartJS